Property Investment
Revealed: The Top Areas for House Price Growth

New research has revealed the areas for house price growth since 2019. The analysis by Propertista looked at property prices across England by Local Authority, revealing the areas with the highest property price growth in terms of percentage rise.
According to the data from the Office for National Statistics (ONS), Oldham in Greater Manchester is the local authority (LA) that has experienced the largest house price growth in England since the start of 2019 with property values rising 44.34 per cent from £130,730 in March 2019 to £188.693 by March this year (2023).
St Helens in Merseyside, near Liverpool, scooped second place with prices rising 41.69 per cent from £129,216 in March 2019 to £183,092 in March 2023.
Meanwhile, the local authority that came in third place was Melton in Leicestershire, where average house prices rose from £224,221 in March 2019 to £315,824 by March 2023; this amounts to a 40.85 er cent increase.
Next up is Burnley in Lancashire where property prices rose by 40.75 per cent, while Rochdale (40.66%), Tameside (40.20%), Wigan (40.13%), Amber Valley (39.12%) Pendle (39.11%) and Nuneaton and Bedworth (39.01%) make up the top 10 local authorities for house price growth.
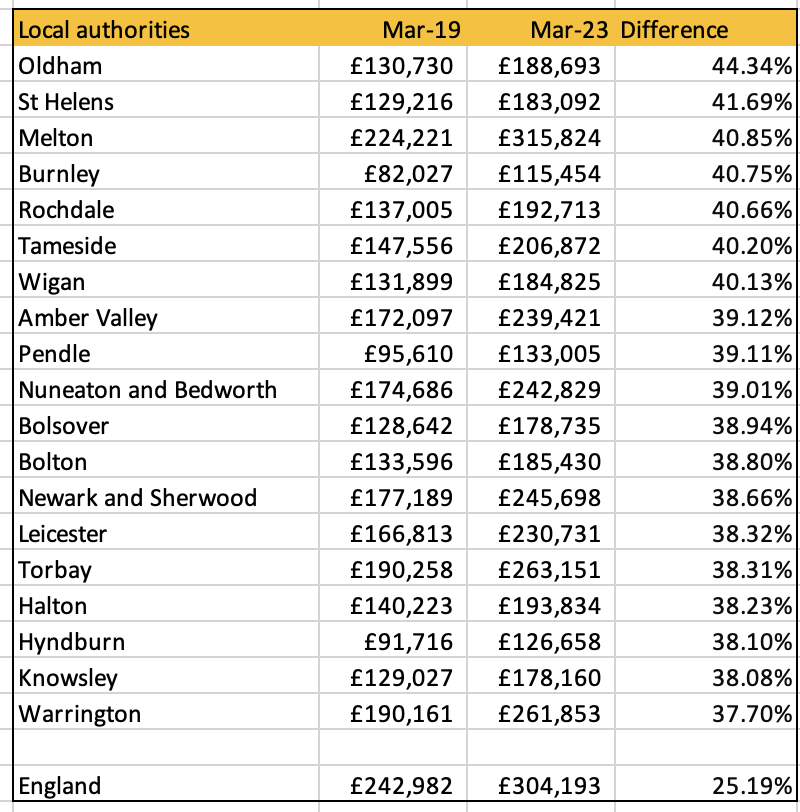
Nationwide, across England, prices increased by 25.19 per cent from an average of £242,982 in March 2019 to £304,193 in March 2023.
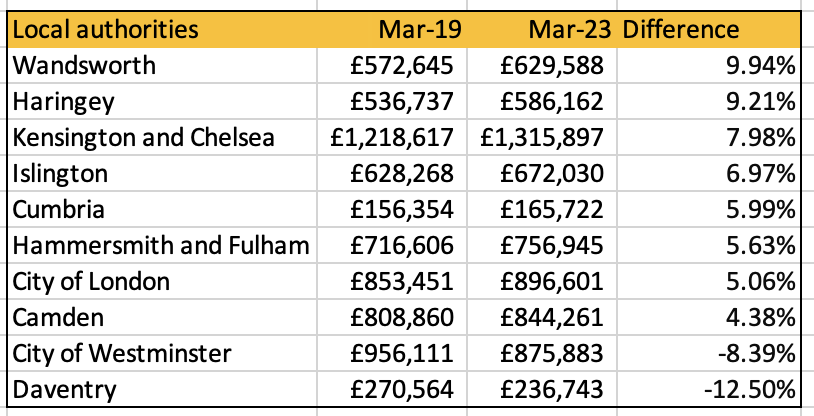
At the other end of the scale, the data revealed two local authorities that experienced negative house price growth over the research period, the worst performer was Daventry in Northamptonshire where prices fell by 12.5 per cent between March 2019 and March 2023 from £270,564 to £236,743, this was followed by the City of Westminster in London where prices fell by 8.39 per cent from £965,111 to £875,833.
In fact, several London LAs were found at the bottom of the table when comparing increases in property price growth by percentage. Camden only managed to secure 4.38 per cent growth in the four-year period, the City of London (5.06%), Hammersmith & Fulham (5.63%), Islington (6.97%), Kensington & Chelsea (7.98%) and Harringay (9.21%). However, when comparing by monetary value increases some of the London LAs actually performed better than their cheaper counterparts. For example, although prices only rose by 7.98 per cent in Kensington & Chelsea, the value difference amounted to over £97,000.
Price changes over the past year
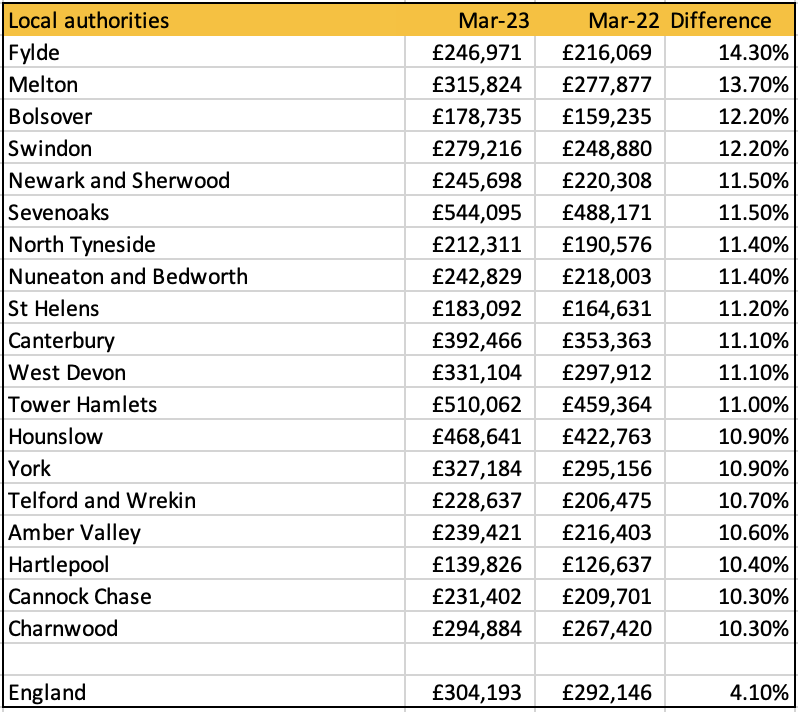
Over the past year, price growth across the English local authorities analysed rose by 4.1 per cent from £292,146 to £304,193.
The top performer for house price growth was Flyde in West Lancashire where average prices rose by 14.3% from £216,069 in March 2022 to £246,971 in March 2023.
Melton came second with prices rising by 13.70 per cent, followed by Bolsova, which has experienced a 12.2 per cent increase in the past year. This was followed by Swindon (+12.2%), Newark & Sherwood (+11.50%), Sevenoaks (11.5%) and North Tyneside (11.40%).
What’s next for house prices?
With the latest interest rate rises it will be interesting to see if property prices continue to rise over the next year and beyond or if they stall or fall… Watch this space to follow the latest property price trends and let us know your views in the comments.


