House prices across every English city have surpassed the previous peak of 2007, new data has revealed.
It has been 12 years since the global financial crisis saw a contraction in mortgage credit, lower housing demand and house price falls. Following the market crash, Central London, Oxford and Cambridge, were the top three fastest cities to return to 2007 levels, taking 2.3 years, 3.7 years and 3.9 years respectively, however, it has taken until December 2019, some 12.2 years, for house prices in the final, monitored English city, Newcastle, to top the 2007 levels, new data from Zoopla’s UK Cities House Price Index has found.
Fig.3 – Years to return to ‘peak 2007’ price level
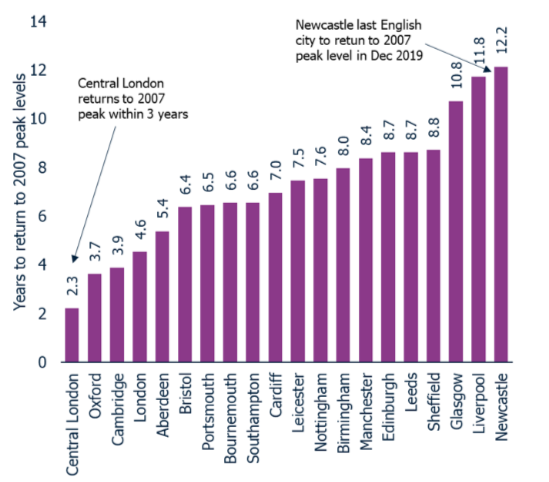
Source: Zoopla Research
A return to peak
The latest Zoopla Index data has recorded an overall annual rate of house price growth across all UK cities of +3.9 per cent – this figure is approaching a three-year high (33 months). The research attributes this increase in the headline rate of growth to increased growth across cities, especially those in the South of England.
Table 1 – UK 20 city index summary, January 2020
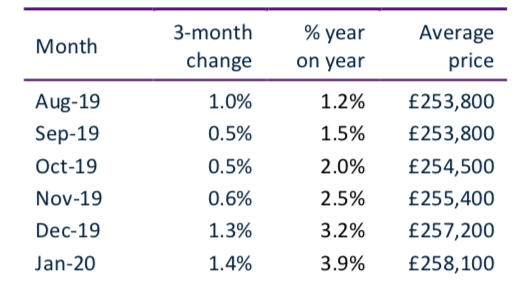
Source: Zoopla House Price Indices, powered by Hometrack
All cities, except for Aberdeen, have recorded annual house price inflation of at least 2 per cent per annum, for the first time since February 2017. This city growth has been led by highs of +5.9 per cent in Edinburgh and +5.3 per cent in Nottingham and Leicester.
Figure 1: City house price inflation – current compared to 12 months ago
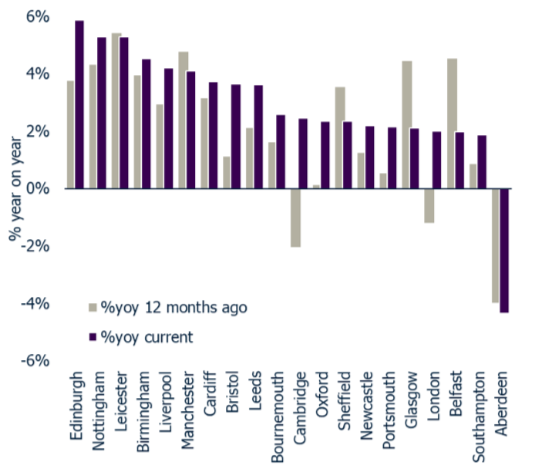
Source: Zoopla UK City House Price Index, powered by Hometrack
Growth in supply fails to keep pace with demand
As we’ve reported previously, strong demand and growing sales are eroding available supply at a faster rate than is being replenished. The total stock of homes available to buy across all UK cities is just 2.6 per cent higher than this time last year, while the stock of homes for sale in nine cities is lower than a year ago by as much as 6 per cent (Fig 2).
Several of the cities where available supply is flat or shrinking are recording higher rates of house price growth, for example, Edinburgh (5.9%) and Nottingham (5.4%).
Eleven cities have more homes for sale than this time last year. Among these, strong demand and attractive affordability mean above-average price growth has been sustained in cities such as Nottingham, Liverpool and Manchester.
The researchers at Zoopla believe the increased supply in Oxford and Cambridge is more likely a result of sellers, who were sitting on their hands waiting for market conditions to improve, deciding to make their move, encouraged by improving sentiment.
Fig.2 – Stock of homes for sale Jan-2020 v Jan-2019
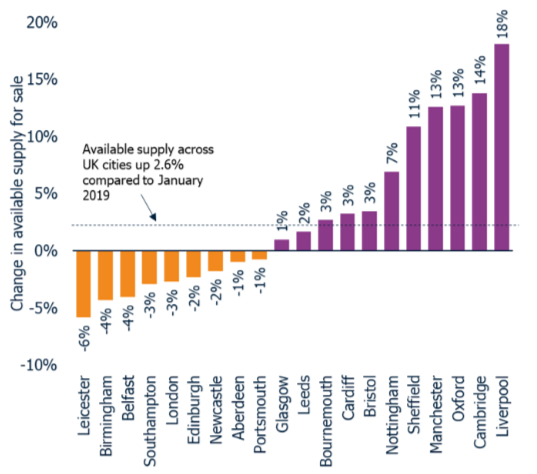
Source: Zoopla Research
Outlook
Commenting on the latest report, Richard Donnell, Director of Research and Insight at Zoopla, said: “An imbalance between supply and demand is supporting the current rate of house price growth – a trend we expect to remain in place over 2020H1.
“The upcoming Budget is a prime opportunity for the new Chancellor to address some of the factors affecting the housing market. Any review of stamp duty charges to help the movement of homeowners up and down the property ladder should be made to boost transaction levels, but the extent and nature of any reform, which must be balanced against political exigencies, remains to be seen,” Donnell concluded.